Affordable BI Tools for Growing Companies 2026 Guide
Feb 17, 2026
Business Intelligence
AI Automation
Data Analytics
Business Intelligence
AI Automation
Data Analytics
In late 2026, finding affordable business intelligence tools for growing companies has become the top priority for data-driven founders. Business intelligence was once a luxury reserved for the Fortune 500, requiring massive capital expenditures and a specialized cohort of data scientists. In that era, smaller companies were forced to fly blind, making critical decisions based on gut feelings and outdated spreadsheets that were often weeks behind reality. The landscape has shifted fundamentally as we move through late 2026, with the democratization of data processing allowing growing companies to access high-level insights without six-figure price tags. Modern business intelligence is no longer about having the largest server room; it is about how intelligently you connect existing data points to drive revenue.
The reality for most founders today is that they are drowning in data but starving for insights. Critical information often sits isolated in your CRM, accounting software, and marketing platforms, yet these systems rarely communicate in a meaningful way. This fragmentation creates a massive operational drag that slows growth and obscures waste. By implementing a streamlined, automated BI framework using specialized business automation tools, you can transform these disconnected data points into a cohesive revenue engine that operates 24/7. Our team at Botomation specializes in bridging this exact gap, replacing slow, manual reporting with lightning-fast custom code and intelligent AI agents that provide clarity the moment you need it.
Implementing AI in small to medium businesses for comprehensive BI automation does not require a complete overhaul of your current tech stack. Instead, it involves a strategic layering of affordable business intelligence tools for growing companies—solutions that offer 80% of the functionality of legacy systems at a fraction of the cost. This guide will walk you through a proven 7-step process to reclaim your time and gain a competitive edge through automated analytics. We focus on practical, high-impact strategies that prioritize operational efficiency and measurable ROI, ensuring your business stays lean while scaling rapidly.
Why Affordable Business Intelligence Tools for Growing Companies are Essential in 2026
The current year marks a turning point where the "Old Way" of managing data—manual exports, VLOOKUPs, and static PDF reports—has become a significant liability. Affordable BI solutions have matured to the point where they now offer native integrations with almost every major SaaS platform, from Shopify to Salesforce. These tools have democratized enterprise-level analytics, allowing a ten-person startup to leverage the same predictive modeling capabilities that were once exclusive to global conglomerates. The shift is driven by the rise of specialized AI agents and cloud-native architectures that handle the heavy lifting of data processing in the background.
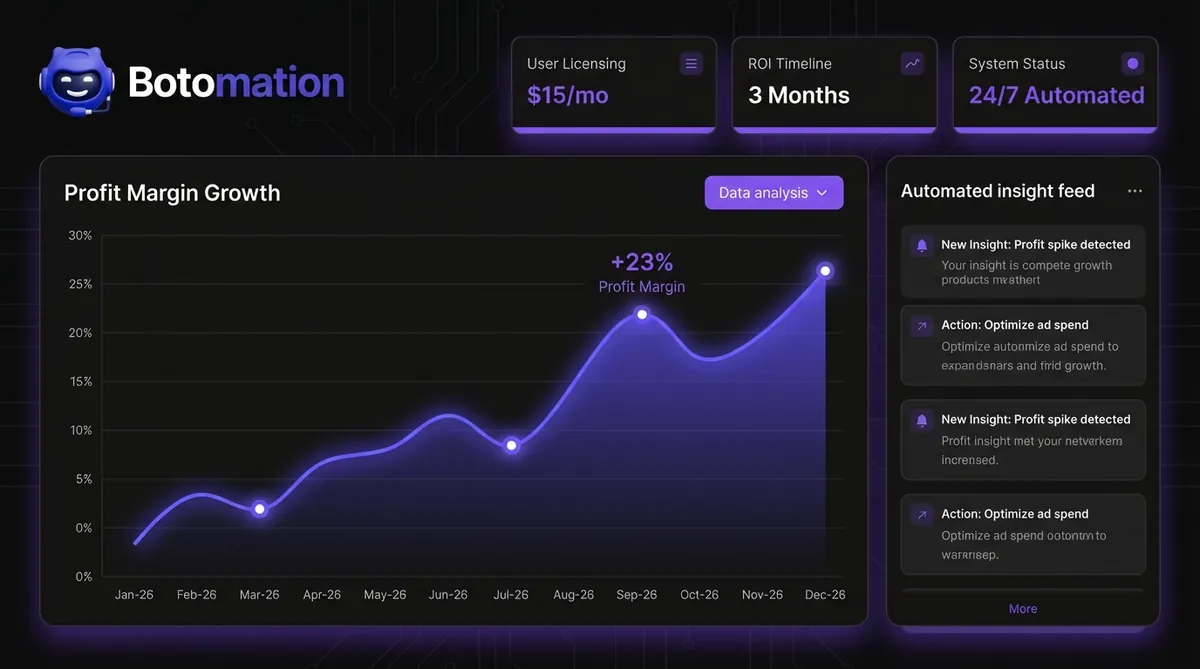
A significant distinction between legacy enterprise suites and the new breed of affordable tools lies in the "time to value." Legacy systems often require eighteen months of implementation before a single useful dashboard is produced. In contrast, modern SMB-focused tools can be deployed in weeks, providing immediate visibility into cash flow, customer acquisition costs, and operational bottlenecks. We recently worked with a mid-market retail company that was struggling with inventory overhead. By moving them away from manual spreadsheets to an automated BI pipeline, they increased their profit margins by 23% within four months. They didn't need a million-dollar software package; they needed a smart connection between their point-of-sale data and their supply chain metrics.
Current BI Landscape for Growing Businesses
Cloud-based solutions have fundamentally rewritten the economics of data, reducing initial setup costs by as much as 75% compared to five years ago. You no longer need to purchase expensive hardware or maintain on-premise servers to run complex queries. The infrastructure is now managed by the providers, allowing your team to focus entirely on interpreting results rather than maintaining the engine. This shift has also led to the rise of "headless BI," where data is processed centrally but can be pushed to any interface, whether it is a Slack notification, a mobile app, or a custom web portal.
Self-service analytics have reached a level of maturity where non-technical staff can build their own reports using natural language queries. Instead of waiting for a data analyst to write a SQL script, a marketing manager can simply ask the system, "Which regions had the highest return on ad spend last week?" and receive a visualized answer instantly. Real-time processing capabilities, once a high-cost feature, are now standard at SMB price points. This allows for proactive decision-making, such as adjusting ad spend the moment a campaign's performance dips, rather than waiting for an end-of-month review.
Cost Comparison: Enterprise vs. Affordable BI Tools
When evaluating the financial impact of BI, the numbers tell a compelling story about why the "Old Way" is failing growing companies. Enterprise BI suites typically demand $150 to $500 per user every month, often bundled with mandatory long-term contracts and expensive "platinum" support tiers. SMB alternatives, such as Power BI Pro or Looker Studio, offer comparable visualization and processing power for $15 to $50 per user. For a team of twenty users, this represents a yearly saving of nearly $100,000 in licensing fees alone—capital that is better spent on product development or market expansion.
| Metric | Legacy Enterprise BI | Affordable BI (Botomation Approach) |
|---|---|---|
| Monthly User Licensing | $150 - $500 | $15 - $50 |
| Initial Implementation | $50,000 - $500,000 | $5,000 - $15,000 |
| Required Staff | Dedicated Data Scientists | Existing Operations Team |
| ROI Timeline | 18 - 24 Months | 3 - 6 Months |
| AI Integration | Patchy/Expensive | Native & Automated |
The implementation gap is even more pronounced when you factor in the cost of specialized consultants. Legacy systems often require a fleet of external experts to configure the data warehouse and build the initial schemas, leading to costs that spiral into the hundreds of thousands. Affordable solutions are designed for rapid deployment, often utilizing pre-built connectors that reduce the "build" phase from months to days. This results in a much more aggressive ROI timeline. While an enterprise suite might take two years to pay for itself, a smartly implemented SMB solution typically reaches the break-even point within the first two quarters of operation.
Step 1: Assessing Your Needs for Affordable Business Intelligence Tools for Growing Companies
Before touching a single piece of software, you must define exactly what success looks like for your organization. Many founders make the mistake of trying to track everything, resulting in "dashboard fatigue" where the sheer volume of data obscures actual insights. The goal is to identify the "vital few" metrics that actually move the needle for your revenue and operational efficiency. This assessment phase is where we help our partners separate vanity metrics—like social media likes or total page views—from the hard data that dictates business health using accessible pricing frameworks.
Effective BI planning in 2026 involves a deep look at your existing "Data Debt." This refers to the messy, unorganized information currently living in various corners of your business. You need to determine which features are essential for your specific model. A subscription-based SaaS company will prioritize churn rates and Lifetime Value (LTV), while a manufacturing firm will focus on machine uptime and supply chain latency. New assessment frameworks in 2026 now use AI to scan your current tech stack and suggest the most impactful KPIs based on industry benchmarks, saving dozens of hours of manual discovery.
How do you identify key metrics and KPIs?
Your automated dashboards should act as a flight deck for your business, providing a clear view of your financial and operational altitude. Revenue and profit margin tracking are the baseline, but true BI depth comes from automating the "why" behind the numbers. For instance, instead of just seeing that revenue is up, an automated system should show that it is driven by a 12% increase in upsells to existing customers in the Northeast region. This level of granularity allows you to double down on what is working in real-time.
Customer acquisition and retention metrics are equally critical for sustainable growth. In a competitive market, knowing your exact CAC (Customer Acquisition Cost) across different channels is the difference between scaling profitably and burning through your runway. Operational efficiency indicators also provide a massive opportunity for cost savings. By tracking the time it takes for a lead to move through your sales pipeline or the average resolution time for support tickets, you can identify precisely where manual tasks are creating friction and automate these administrative tasks to reclaim lost time. Our experts focus on automating these data pulls so your team never has to manually update a "Monthly Progress" slide again.
Budget Planning and ROI Expectations
Investing in business intelligence is not an expense; it is a strategic allocation of capital designed to generate a high return. Data from 2024 and 2026 shows that the average SMB BI investment returns between 300% and 500% within the first twelve months. These returns manifest as reduced labor costs, optimized marketing spend, and the prevention of expensive operational errors. When planning your budget, we recommend a balanced allocation: 60% for the software and infrastructure, 25% for professional implementation to ensure the foundation is solid, and 15% for team training.
The 2026 BI Efficiency Gap
Companies utilizing automated BI tools report a 42% faster response time to market shifts compared to those using manual spreadsheet reporting. The average cost of a manual data error in 2024 was estimated at $12,500 per incident for mid-sized firms. Transitioning to automated validation reduces these errors by approximately 98%.
Setting realistic timelines is vital for maintaining stakeholder buy-in. While the "New Way" of BI is much faster than legacy methods, it still requires a period of data stabilization. You should expect to see basic visibility within the first 30 days, followed by deeper automated insights and predictive capabilities by the 90-day mark. This phased approach allows your team to acclimate to the new data-driven culture without feeling overwhelmed. By the end of the first year, the system should be essentially self-sustaining, with AI agents handling routine reporting while your leadership team focuses on high-level strategy.
Step 2: Selecting Affordable Enterprise-Grade BI Tools
Choosing the right tool is less about finding the "best" software and more about finding the best fit for your existing ecosystem. In 2026, the market is saturated with options, but three primary contenders consistently deliver enterprise-grade for small business power at an SMB price point. The key is to look for scalable business tools that offer robust API support and "low-code" environments. This ensures that as your business grows, your BI platform can scale with you without requiring a total migration.
Integration capability is the most important factor in your selection process. If a tool cannot easily talk to your CRM, your project management software, and your financial tools, it will eventually become another siloed data island. We often see companies fall into the trap of choosing a tool because it has "pretty" visualizations, only to realize later that getting data into it requires hours of manual work. A case study that illustrates this perfectly is a SaaS startup we partnered with last year. They were considering a high-end enterprise platform but eventually chose Looker Studio combined with custom-coded data connectors. This setup provided the exact same insights at 10% of the projected cost, allowing them to reinvest the savings into their engineering team.
What are the top affordable BI solutions in 2026?
Power BI Pro remains a dominant force for businesses already operating within the Microsoft ecosystem. At approximately $20 per user per month, it provides a level of depth that was unthinkable at that price point just a few years ago. Its primary strength lies in its seamless integration with Excel, Teams, and Azure, making it a natural choice for companies that want a unified environment. In 2026, Power BI has integrated advanced GPT-5 powered features that allow users to generate complex DAX formulas using simple English commands, significantly lowering the barrier to entry for non-technical users.
For those who prioritize high-end data storytelling and visualization, Tableau Public and its tiered commercial versions offer unparalleled creative control. While it can have a steeper learning curve, the community support and depth of visualization options are world-class. Alternatively, the combination of Google Analytics 4 and Looker Studio offers a powerful, often free-to-start solution for companies focused heavily on digital marketing and e-commerce. Looker Studio’s strength is its simplicity and its ability to pull data from across the Google Marketing Platform with zero configuration, making it the fastest way to get a marketing dashboard live.
Integration and Compatibility Assessment
Before committing to a platform, you must perform a technical audit of your data sources. Most modern tools offer "native connectors" for popular services like Shopify, HubSpot, or QuickBooks. However, for custom-built legacy systems or niche industry software, you may need to leverage APIs (Application Programming Interfaces). A tool’s API flexibility determines how easily you can automate the flow of data. In 2026, we look for "GraphQL" or "RESTful" API support as the gold standard for reliable, high-speed data transfers.
Data connector capabilities are the "pipes" of your BI system. You want to ensure these pipes are "bi-directional" where possible, allowing your BI tool not just to read data, but to trigger actions in other systems. For example, if your BI dashboard detects that a customer's usage has dropped significantly, it could automatically trigger a task in your CRM for a success manager to reach out. This level of automation is what separates a simple "report" from a true "revenue engine." Export and sharing features are also vital; your team needs to be able to share insights easily via Slack, email, or mobile alerts to ensure the data is actually used in daily operations.
Step 3: Data Integration and Centralization
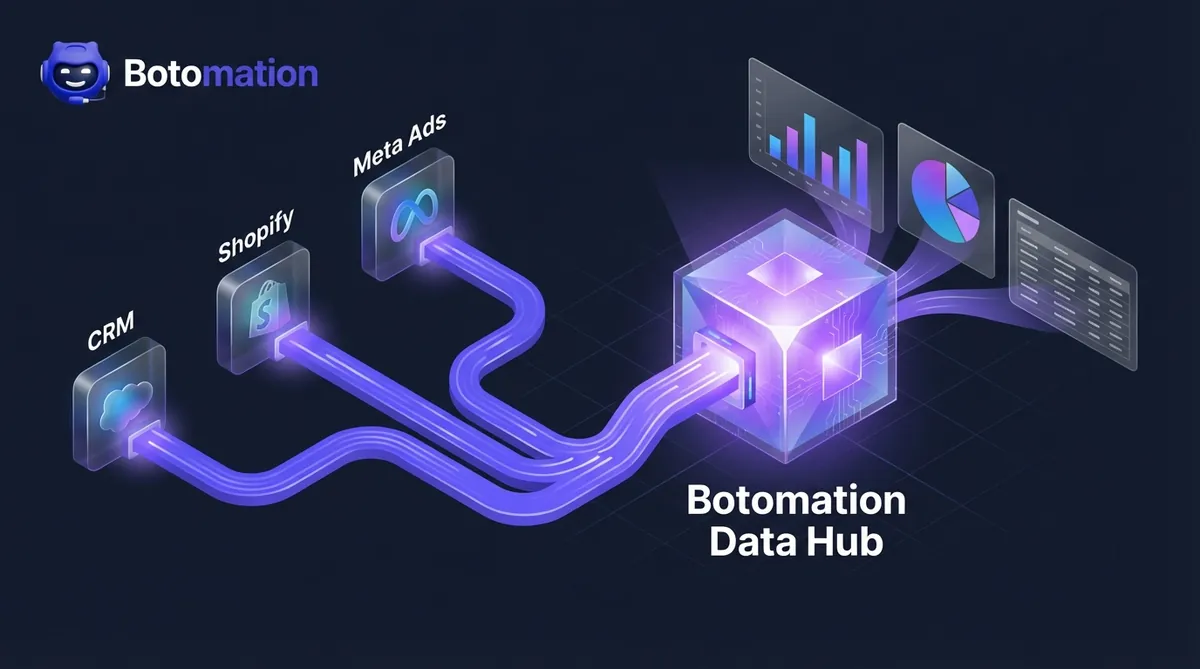
The biggest hurdle to effective business intelligence is the "Data Silo" problem. By eliminating data silos between business applications, you ensure that marketing data, sales data, and fulfillment data are no longer isolated. To get a true picture of your business, these must be consolidated into a "Single Source of Truth." This process, known as ETL (Extract, Transform, Load), has been simplified in 2026 through automated pipelines that clean and organize your data as it moves from the source to your BI tool.
Automating these workflows is where Botomation provides the most value. Instead of having an employee spend every Monday morning downloading CSV files and copy-pasting them into a master sheet, we build custom AI agents that replace manual data entry to handle this 24/7. These agents don't just move data; they check it for errors, normalize the formatting, and ensure that a "Customer ID" in your cost-effective CRM matches the "Lead ID" in your marketing tools. This level of data integrity is essential for making decisions you can actually trust. Without centralization, you are often looking at conflicting numbers, which leads to "analysis paralysis" and missed opportunities.
Data Source Identification and Connection
The first phase of integration is mapping every touchpoint where your business generates information. This includes your CRM for customer interactions, your ERP or accounting system for financial health, and your project management tools for operational output. For e-commerce businesses, connecting directly to platforms like Shopify or Amazon Seller Central is non-negotiable. These connections must be "live" or "near-live" to ensure that your dashboards reflect the current state of the business, not where it was three days ago.
Marketing and advertising platforms present a unique challenge due to the sheer volume of data they produce. Integrating Google Ads, Meta Ads, and LinkedIn Campaign Manager allows you to see a "blended" view of your performance. This is critical because a customer might see an ad on LinkedIn, click an ad on Google, and finally convert through an email. Only an integrated BI system can accurately attribute that sale and help you understand your true return on ad spend (ROAS). By centralizing this, you can see the entire customer journey in one place, rather than trying to piece it together from five different browser tabs.
Quality Control and Validation Processes
Raw data is often "noisy." It contains duplicates, missing fields, and formatting inconsistencies that can skew your results. Automated data cleansing is the process of scrubbing this information before it hits your dashboard. For example, if one system records a phone number as "555-0199" and another as "(555) 0199," a smart validation system will normalize these into a single format. This prevents the system from seeing them as two different records, ensuring your customer counts and attribution models remain accurate.
Validation rules act as a "firewall" for your BI system. By implementing real-time data entry validation, you can set up automated checks that flag any data that seems impossible or highly unlikely. If a salesperson accidentally enters a deal for $1,000,000 instead of $10,000, the system can catch this outlier and send an alert for manual review before it distorts your monthly revenue projections. These automated safeguards build confidence in the system. When your leadership team knows the data has been through a rigorous validation process, they are much more likely to take decisive action based on the insights provided.
Step 4: Building Automated Analytics Dashboards
A dashboard is only useful if it leads to action. In the "Old Way," dashboards were often just a collection of charts that looked impressive but didn't tell you what to do. In 2026, we focus on "Actionable BI," where the interface is designed to answer specific business questions using high-performance business systems. The design should follow a logical hierarchy: the most critical "Health" metrics at the top, followed by "Diagnostic" metrics that explain trends, and finally granular data for deep-dive investigations.
Automation extends beyond just the data feed; it includes the distribution of insights. You shouldn't have to log into a portal to know if something is wrong. Automated alerts can be configured to ping your leadership team on Slack if a KPI falls outside of a predefined range. For instance, if your website conversion rate drops by more than 20% in a single day, an automated alert can trigger an immediate investigation. This proactive approach saved one of our manufacturing clients nearly $40,000 in a single week when the system detected a sudden spike in material waste that would have otherwise gone unnoticed until the end-of-month audit.
How do you automate report generation?
Effective design is about reducing "cognitive load." When you look at a dashboard, you should be able to understand the state of your business in five seconds or less. This is achieved through a clear visual hierarchy and the strategic use of color. We use "Red-Amber-Green" (RAG) status indicators to immediately draw the eye to areas that require attention. If your customer retention is in the "Green," you can move on; if it is in the "Red," you know exactly where to start your day.
Mobile responsiveness is no longer an optional feature. Founders and CEOs are rarely sitting at a desk all day; they need to check their "revenue engine" while in transit or between meetings. Modern BI tools like Power BI and Looker Studio allow for "mobile-first" layouts that reorganize the charts into a single-column view for easy scrolling. This ensures that the most important data is always at your fingertips, regardless of where you are. We also prioritize "drill-down" capabilities, allowing users to click on a high-level chart to see the underlying data points without leaving the interface.
Automation and Alert Configuration
Setting up the right alerts is a balancing act. Too many alerts lead to "notification fatigue," where the team starts ignoring them. We recommend starting with threshold-based alerts for your top three KPIs. These are triggered only when a metric crosses a critical boundary. For example, an alert could be sent if "Available Cash" drops below a certain level or if "Customer Support Response Time" exceeds four hours. This ensures that when an alert happens, the team knows it is important and requires immediate action.
Automated executive reporting and distribution can replace hours of manual administrative work. Instead of a manager spending Friday afternoon compiling a weekly update, the BI system can automatically generate a PDF summary and email it to the board of directors at 5:00 PM. These reports can be customized for different audiences; the CEO gets a high-level strategic summary, while department heads get a detailed operational breakdown. Scheduled data refreshes ensure that everyone is looking at the same numbers at the same time, eliminating the common boardroom argument over whose spreadsheet is "more correct."
Step 5: User Training and Adoption Strategies
The most sophisticated BI system in the world is worthless if your team doesn't use it. Resistance to new technology is a natural human reaction, especially when it involves shifting from "gut feeling" to data-driven decision-making. Successful adoption requires a structured change management strategy that focuses on the value proposition for every employee. You need to demonstrate how the new system will make their jobs easier, reduce their manual workload, and help them achieve their personal performance targets.
In 2026, the secret weapon for adoption is the integration of AI-powered training assistants. These tools live inside the BI platform and can answer user questions in real-time. If a team member is unsure how to filter a report, they can simply ask the AI assistant, "Show me last month's sales for the West Coast," and the assistant will guide them through the process. This reduces the burden on your IT department and allows users to learn at their own pace. We also recommend identifying "Data Champions" within each department—early adopters who can help their colleagues and advocate for the benefits of the new system.
Training Program Implementation
A "one-size-fits-all" training approach rarely works. A sales rep needs to know how to track their pipeline, while an HR manager needs to understand employee turnover trends. We advocate for role-based training modules that focus only on the features relevant to each person's daily tasks. This keeps the training concise and high-impact. Video tutorials and a searchable internal knowledge base are also essential for self-paced learning, allowing new hires to get up to speed quickly without needing a formal workshop.
Hands-on workshops are the most effective way to build confidence. During these sessions, we encourage users to bring real-world problems they are trying to solve. By showing them how to find the answer in the BI tool during the training, the value becomes immediate and tangible. This active learning approach ensures that the information sticks and that the team feels empowered rather than intimidated by the new technology. The goal is to move the team from "having to use the tool" to "wanting to use the tool" because it makes their lives demonstrably better.
Change Management and Engagement
Addressing the psychological barriers to data adoption is as important as the technical setup. Some employees may fear that increased visibility will lead to micromanagement. It is critical to frame the BI system as a tool for empowerment and transparency, not surveillance. When everyone has access to the same data, it levels the playing field and allows for more objective performance reviews and resource allocation. Celebrating "Data Wins"—such as when an automated insight leads to a major cost saving—helps to build a positive culture around the new system.
Measuring adoption success is the final piece of the puzzle. Most modern BI tools provide usage analytics that show which reports are being viewed most frequently and by whom. If you notice that a particular department isn't using the system, you can proactively reach out to understand their challenges and provide additional support. Engagement is not a single event; it is a continuous process of gathering feedback and refining the system to better meet user needs. By listening to your team and making iterative improvements, you ensure that the BI system remains a vital part of your business's growth engine.
Step 6: Ensuring Security and Compliance in a Data-Driven World
As you centralize your business intelligence, the security of that data becomes paramount. In 2026, with regulations like GDPR, CCPA, and evolving AI-specific laws, you cannot afford a "set it and forget it" mentality toward data privacy. A single breach of customer information or proprietary financial data can result in catastrophic fines and irreparable brand damage. When we build automated BI systems at Botomation, we prioritize "Security by Design," ensuring that your data is encrypted both at rest and in transit.
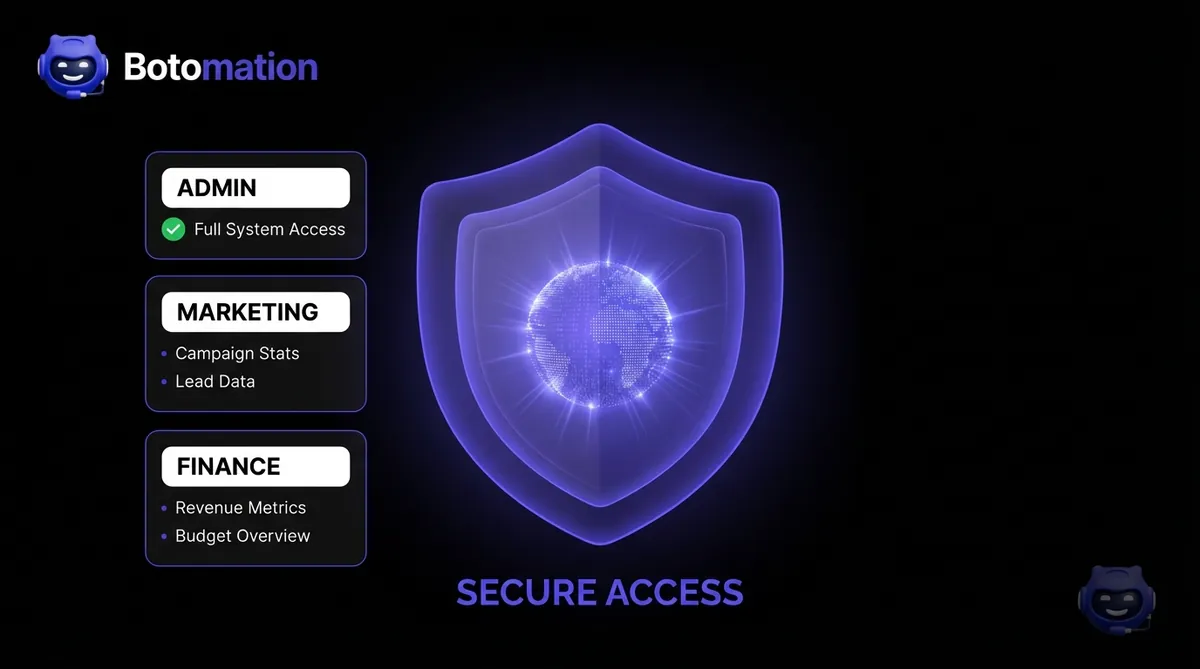
Implementing Role-Based Access Control (RBAC) is the first line of defense. Not everyone in your organization needs access to every piece of data. Your marketing team needs to see campaign performance, but they likely don't need access to individual employee salary data or detailed company tax records. Modern BI tools allow for granular permission settings, ensuring that users only see the information necessary for their specific role. This "Principle of Least Privilege" significantly reduces the risk of accidental or malicious data exposure.
Automated Security Audits and Compliance
In the "Old Way," security audits were a manual, once-a-year headache. In 2026, we automate this process. We set up systems that continuously monitor for unauthorized access attempts or unusual data export patterns. If an employee who typically only views three reports a day suddenly tries to download your entire customer database at 2:00 AM, the system can automatically block the action and alert your security team. This real-time protection is essential for protecting your intellectual property in a digital-first economy.
Compliance is also handled through automation. We configure data pipelines to automatically anonymize or pseudonymize sensitive customer information before it enters the visualization layer. This allows your team to analyze trends and behaviors without ever seeing personally identifiable information (PII). By building these compliance checks directly into the code, you ensure that your business stays on the right side of the law without adding extra administrative burden to your team.
Step 7: Continuous Optimization and the Feedback Loop
The final step in automating your business intelligence is recognizing that it is a living system. Your business will evolve, your competitors will change their tactics, and new data sources will emerge. A static BI setup will eventually become obsolete. To maintain your competitive edge, you must implement a continuous optimization loop. This involves reviewing your KPIs every quarter to ensure they are still aligned with your high-level business goals and adjusting your dashboards based on user feedback.
We use AI agents to monitor the performance of the BI system itself. These agents can identify "Data Drift," where the relationship between variables changes over time, potentially making your predictive models less accurate. By catching these shifts early, we can recalibrate the algorithms to ensure your insights remain razor-sharp. This iterative approach is what allows our partners to stay ahead of the curve, constantly finding new ways to squeeze more efficiency and revenue out of their operations using modern SMB tools.
Building a Data-Driven Culture
Ultimately, the goal of these seven steps is to foster a culture where data is the language of the company. When every meeting starts with a look at the automated dashboard rather than a series of opinions, the quality of decision-making improves exponentially. This shift in culture is the real "revenue engine." It allows your team to move faster, take calculated risks with confidence, and pivot quickly when the data shows a change in market conditions.
Our experts at Botomation don't just hand over a tool; we partner with you to ensure this culture takes root. We help you refine your processes so that the insights generated by the BI system are translated into tangible business actions. Whether it's optimizing your supply chain, refining your sales scripts, or reallocating your marketing budget, the data provides the roadmap. By following this 7-step framework, you are not just installing software—you are building a smarter, more resilient version of your business that is ready for whatever 2026 and beyond might bring.
Frequently Asked Questions
Do I need a dedicated data scientist to manage these tools?
No. Modern affordable business intelligence tools for growing companies are designed for self-service, meaning they can be managed by your existing operations or IT team. Our agency handles the complex initial setup and custom coding, leaving you with a user-friendly interface that doesn't require advanced technical skills to operate daily.
How long does it take to see a return on investment?
Most growing companies see a measurable ROI within three to six months. This typically comes from identifying wasted ad spend, reducing manual reporting hours, and improving customer retention through better data visibility. The "New Way" of BI focuses on quick wins that fund longer-term automation goals.
Can these tools handle data from custom-built legacy systems?
Yes. Through custom API integrations and automated ETL (Extract, Transform, Load) pipelines, we can pull data from almost any source. Even if your software is decades old, as long as there is a way to export the data or access the database, we can integrate it into your modern BI dashboard.
Is my data safe in a cloud-based BI tool?
Enterprise-grade tools like Power BI and Looker Studio use the same security protocols as global banks. When combined with our custom security configurations, such as multi-factor authentication and role-based access, your data is often more secure in these environments than it is on a local office server.
What happens if our business needs change in a year?
The beauty of affordable, modern BI is its flexibility. Unlike legacy systems that are hard-coded and difficult to change, our cloud-native approach allows for rapid adjustments. We can add new data sources, create new KPIs, and modify your dashboards in days, ensuring your BI system scales alongside your business.
Ready to automate your growth? Stop losing money to manual processes and opaque data. Our team of experts is ready to build your custom revenue engine using high-speed code and intelligent AI agents. Book a call below to start your transition to the New Way of business intelligence.
In late 2026, finding affordable business intelligence tools for growing companies has become the top priority for data-driven founders. Business intelligence was once a luxury reserved for the Fortune 500, requiring massive capital expenditures and a specialized cohort of data scientists. In that era, smaller companies were forced to fly blind, making critical decisions based on gut feelings and outdated spreadsheets that were often weeks behind reality. The landscape has shifted fundamentally as we move through late 2026, with the democratization of data processing allowing growing companies to access high-level insights without six-figure price tags. Modern business intelligence is no longer about having the largest server room; it is about how intelligently you connect existing data points to drive revenue.
The reality for most founders today is that they are drowning in data but starving for insights. Critical information often sits isolated in your CRM, accounting software, and marketing platforms, yet these systems rarely communicate in a meaningful way. This fragmentation creates a massive operational drag that slows growth and obscures waste. By implementing a streamlined, automated BI framework using specialized business automation tools, you can transform these disconnected data points into a cohesive revenue engine that operates 24/7. Our team at Botomation specializes in bridging this exact gap, replacing slow, manual reporting with lightning-fast custom code and intelligent AI agents that provide clarity the moment you need it.
Implementing AI in small to medium businesses for comprehensive BI automation does not require a complete overhaul of your current tech stack. Instead, it involves a strategic layering of affordable business intelligence tools for growing companies—solutions that offer 80% of the functionality of legacy systems at a fraction of the cost. This guide will walk you through a proven 7-step process to reclaim your time and gain a competitive edge through automated analytics. We focus on practical, high-impact strategies that prioritize operational efficiency and measurable ROI, ensuring your business stays lean while scaling rapidly.
Why Affordable Business Intelligence Tools for Growing Companies are Essential in 2026
The current year marks a turning point where the "Old Way" of managing data—manual exports, VLOOKUPs, and static PDF reports—has become a significant liability. Affordable BI solutions have matured to the point where they now offer native integrations with almost every major SaaS platform, from Shopify to Salesforce. These tools have democratized enterprise-level analytics, allowing a ten-person startup to leverage the same predictive modeling capabilities that were once exclusive to global conglomerates. The shift is driven by the rise of specialized AI agents and cloud-native architectures that handle the heavy lifting of data processing in the background.
A significant distinction between legacy enterprise suites and the new breed of affordable tools lies in the "time to value." Legacy systems often require eighteen months of implementation before a single useful dashboard is produced. In contrast, modern SMB-focused tools can be deployed in weeks, providing immediate visibility into cash flow, customer acquisition costs, and operational bottlenecks. We recently worked with a mid-market retail company that was struggling with inventory overhead. By moving them away from manual spreadsheets to an automated BI pipeline, they increased their profit margins by 23% within four months. They didn't need a million-dollar software package; they needed a smart connection between their point-of-sale data and their supply chain metrics.
Current BI Landscape for Growing Businesses
Cloud-based solutions have fundamentally rewritten the economics of data, reducing initial setup costs by as much as 75% compared to five years ago. You no longer need to purchase expensive hardware or maintain on-premise servers to run complex queries. The infrastructure is now managed by the providers, allowing your team to focus entirely on interpreting results rather than maintaining the engine. This shift has also led to the rise of "headless BI," where data is processed centrally but can be pushed to any interface, whether it is a Slack notification, a mobile app, or a custom web portal.
Self-service analytics have reached a level of maturity where non-technical staff can build their own reports using natural language queries. Instead of waiting for a data analyst to write a SQL script, a marketing manager can simply ask the system, "Which regions had the highest return on ad spend last week?" and receive a visualized answer instantly. Real-time processing capabilities, once a high-cost feature, are now standard at SMB price points. This allows for proactive decision-making, such as adjusting ad spend the moment a campaign's performance dips, rather than waiting for an end-of-month review.
Cost Comparison: Enterprise vs. Affordable BI Tools
When evaluating the financial impact of BI, the numbers tell a compelling story about why the "Old Way" is failing growing companies. Enterprise BI suites typically demand $150 to $500 per user every month, often bundled with mandatory long-term contracts and expensive "platinum" support tiers. SMB alternatives, such as Power BI Pro or Looker Studio, offer comparable visualization and processing power for $15 to $50 per user. For a team of twenty users, this represents a yearly saving of nearly $100,000 in licensing fees alone—capital that is better spent on product development or market expansion.
| Metric | Legacy Enterprise BI | Affordable BI (Botomation Approach) |
|---|---|---|
| Monthly User Licensing | $150 - $500 | $15 - $50 |
| Initial Implementation | $50,000 - $500,000 | $5,000 - $15,000 |
| Required Staff | Dedicated Data Scientists | Existing Operations Team |
| ROI Timeline | 18 - 24 Months | 3 - 6 Months |
| AI Integration | Patchy/Expensive | Native & Automated |
The implementation gap is even more pronounced when you factor in the cost of specialized consultants. Legacy systems often require a fleet of external experts to configure the data warehouse and build the initial schemas, leading to costs that spiral into the hundreds of thousands. Affordable solutions are designed for rapid deployment, often utilizing pre-built connectors that reduce the "build" phase from months to days. This results in a much more aggressive ROI timeline. While an enterprise suite might take two years to pay for itself, a smartly implemented SMB solution typically reaches the break-even point within the first two quarters of operation.
Step 1: Assessing Your Needs for Affordable Business Intelligence Tools for Growing Companies
Before touching a single piece of software, you must define exactly what success looks like for your organization. Many founders make the mistake of trying to track everything, resulting in "dashboard fatigue" where the sheer volume of data obscures actual insights. The goal is to identify the "vital few" metrics that actually move the needle for your revenue and operational efficiency. This assessment phase is where we help our partners separate vanity metrics—like social media likes or total page views—from the hard data that dictates business health using accessible pricing frameworks.
Effective BI planning in 2026 involves a deep look at your existing "Data Debt." This refers to the messy, unorganized information currently living in various corners of your business. You need to determine which features are essential for your specific model. A subscription-based SaaS company will prioritize churn rates and Lifetime Value (LTV), while a manufacturing firm will focus on machine uptime and supply chain latency. New assessment frameworks in 2026 now use AI to scan your current tech stack and suggest the most impactful KPIs based on industry benchmarks, saving dozens of hours of manual discovery.
How do you identify key metrics and KPIs?
Your automated dashboards should act as a flight deck for your business, providing a clear view of your financial and operational altitude. Revenue and profit margin tracking are the baseline, but true BI depth comes from automating the "why" behind the numbers. For instance, instead of just seeing that revenue is up, an automated system should show that it is driven by a 12% increase in upsells to existing customers in the Northeast region. This level of granularity allows you to double down on what is working in real-time.
Customer acquisition and retention metrics are equally critical for sustainable growth. In a competitive market, knowing your exact CAC (Customer Acquisition Cost) across different channels is the difference between scaling profitably and burning through your runway. Operational efficiency indicators also provide a massive opportunity for cost savings. By tracking the time it takes for a lead to move through your sales pipeline or the average resolution time for support tickets, you can identify precisely where manual tasks are creating friction and automate these administrative tasks to reclaim lost time. Our experts focus on automating these data pulls so your team never has to manually update a "Monthly Progress" slide again.
Budget Planning and ROI Expectations
Investing in business intelligence is not an expense; it is a strategic allocation of capital designed to generate a high return. Data from 2024 and 2026 shows that the average SMB BI investment returns between 300% and 500% within the first twelve months. These returns manifest as reduced labor costs, optimized marketing spend, and the prevention of expensive operational errors. When planning your budget, we recommend a balanced allocation: 60% for the software and infrastructure, 25% for professional implementation to ensure the foundation is solid, and 15% for team training.
The 2026 BI Efficiency Gap
Companies utilizing automated BI tools report a 42% faster response time to market shifts compared to those using manual spreadsheet reporting. The average cost of a manual data error in 2024 was estimated at $12,500 per incident for mid-sized firms. Transitioning to automated validation reduces these errors by approximately 98%.
Setting realistic timelines is vital for maintaining stakeholder buy-in. While the "New Way" of BI is much faster than legacy methods, it still requires a period of data stabilization. You should expect to see basic visibility within the first 30 days, followed by deeper automated insights and predictive capabilities by the 90-day mark. This phased approach allows your team to acclimate to the new data-driven culture without feeling overwhelmed. By the end of the first year, the system should be essentially self-sustaining, with AI agents handling routine reporting while your leadership team focuses on high-level strategy.
Step 2: Selecting Affordable Enterprise-Grade BI Tools
Choosing the right tool is less about finding the "best" software and more about finding the best fit for your existing ecosystem. In 2026, the market is saturated with options, but three primary contenders consistently deliver enterprise-grade for small business power at an SMB price point. The key is to look for scalable business tools that offer robust API support and "low-code" environments. This ensures that as your business grows, your BI platform can scale with you without requiring a total migration.
Integration capability is the most important factor in your selection process. If a tool cannot easily talk to your CRM, your project management software, and your financial tools, it will eventually become another siloed data island. We often see companies fall into the trap of choosing a tool because it has "pretty" visualizations, only to realize later that getting data into it requires hours of manual work. A case study that illustrates this perfectly is a SaaS startup we partnered with last year. They were considering a high-end enterprise platform but eventually chose Looker Studio combined with custom-coded data connectors. This setup provided the exact same insights at 10% of the projected cost, allowing them to reinvest the savings into their engineering team.
What are the top affordable BI solutions in 2026?
Power BI Pro remains a dominant force for businesses already operating within the Microsoft ecosystem. At approximately $20 per user per month, it provides a level of depth that was unthinkable at that price point just a few years ago. Its primary strength lies in its seamless integration with Excel, Teams, and Azure, making it a natural choice for companies that want a unified environment. In 2026, Power BI has integrated advanced GPT-5 powered features that allow users to generate complex DAX formulas using simple English commands, significantly lowering the barrier to entry for non-technical users.
For those who prioritize high-end data storytelling and visualization, Tableau Public and its tiered commercial versions offer unparalleled creative control. While it can have a steeper learning curve, the community support and depth of visualization options are world-class. Alternatively, the combination of Google Analytics 4 and Looker Studio offers a powerful, often free-to-start solution for companies focused heavily on digital marketing and e-commerce. Looker Studio’s strength is its simplicity and its ability to pull data from across the Google Marketing Platform with zero configuration, making it the fastest way to get a marketing dashboard live.
Integration and Compatibility Assessment
Before committing to a platform, you must perform a technical audit of your data sources. Most modern tools offer "native connectors" for popular services like Shopify, HubSpot, or QuickBooks. However, for custom-built legacy systems or niche industry software, you may need to leverage APIs (Application Programming Interfaces). A tool’s API flexibility determines how easily you can automate the flow of data. In 2026, we look for "GraphQL" or "RESTful" API support as the gold standard for reliable, high-speed data transfers.
Data connector capabilities are the "pipes" of your BI system. You want to ensure these pipes are "bi-directional" where possible, allowing your BI tool not just to read data, but to trigger actions in other systems. For example, if your BI dashboard detects that a customer's usage has dropped significantly, it could automatically trigger a task in your CRM for a success manager to reach out. This level of automation is what separates a simple "report" from a true "revenue engine." Export and sharing features are also vital; your team needs to be able to share insights easily via Slack, email, or mobile alerts to ensure the data is actually used in daily operations.
Step 3: Data Integration and Centralization
The biggest hurdle to effective business intelligence is the "Data Silo" problem. By eliminating data silos between business applications, you ensure that marketing data, sales data, and fulfillment data are no longer isolated. To get a true picture of your business, these must be consolidated into a "Single Source of Truth." This process, known as ETL (Extract, Transform, Load), has been simplified in 2026 through automated pipelines that clean and organize your data as it moves from the source to your BI tool.
Automating these workflows is where Botomation provides the most value. Instead of having an employee spend every Monday morning downloading CSV files and copy-pasting them into a master sheet, we build custom AI agents that replace manual data entry to handle this 24/7. These agents don't just move data; they check it for errors, normalize the formatting, and ensure that a "Customer ID" in your cost-effective CRM matches the "Lead ID" in your marketing tools. This level of data integrity is essential for making decisions you can actually trust. Without centralization, you are often looking at conflicting numbers, which leads to "analysis paralysis" and missed opportunities.
Data Source Identification and Connection
The first phase of integration is mapping every touchpoint where your business generates information. This includes your CRM for customer interactions, your ERP or accounting system for financial health, and your project management tools for operational output. For e-commerce businesses, connecting directly to platforms like Shopify or Amazon Seller Central is non-negotiable. These connections must be "live" or "near-live" to ensure that your dashboards reflect the current state of the business, not where it was three days ago.
Marketing and advertising platforms present a unique challenge due to the sheer volume of data they produce. Integrating Google Ads, Meta Ads, and LinkedIn Campaign Manager allows you to see a "blended" view of your performance. This is critical because a customer might see an ad on LinkedIn, click an ad on Google, and finally convert through an email. Only an integrated BI system can accurately attribute that sale and help you understand your true return on ad spend (ROAS). By centralizing this, you can see the entire customer journey in one place, rather than trying to piece it together from five different browser tabs.
Quality Control and Validation Processes
Raw data is often "noisy." It contains duplicates, missing fields, and formatting inconsistencies that can skew your results. Automated data cleansing is the process of scrubbing this information before it hits your dashboard. For example, if one system records a phone number as "555-0199" and another as "(555) 0199," a smart validation system will normalize these into a single format. This prevents the system from seeing them as two different records, ensuring your customer counts and attribution models remain accurate.
Validation rules act as a "firewall" for your BI system. By implementing real-time data entry validation, you can set up automated checks that flag any data that seems impossible or highly unlikely. If a salesperson accidentally enters a deal for $1,000,000 instead of $10,000, the system can catch this outlier and send an alert for manual review before it distorts your monthly revenue projections. These automated safeguards build confidence in the system. When your leadership team knows the data has been through a rigorous validation process, they are much more likely to take decisive action based on the insights provided.
Step 4: Building Automated Analytics Dashboards
A dashboard is only useful if it leads to action. In the "Old Way," dashboards were often just a collection of charts that looked impressive but didn't tell you what to do. In 2026, we focus on "Actionable BI," where the interface is designed to answer specific business questions using high-performance business systems. The design should follow a logical hierarchy: the most critical "Health" metrics at the top, followed by "Diagnostic" metrics that explain trends, and finally granular data for deep-dive investigations.
Automation extends beyond just the data feed; it includes the distribution of insights. You shouldn't have to log into a portal to know if something is wrong. Automated alerts can be configured to ping your leadership team on Slack if a KPI falls outside of a predefined range. For instance, if your website conversion rate drops by more than 20% in a single day, an automated alert can trigger an immediate investigation. This proactive approach saved one of our manufacturing clients nearly $40,000 in a single week when the system detected a sudden spike in material waste that would have otherwise gone unnoticed until the end-of-month audit.
How do you automate report generation?
Effective design is about reducing "cognitive load." When you look at a dashboard, you should be able to understand the state of your business in five seconds or less. This is achieved through a clear visual hierarchy and the strategic use of color. We use "Red-Amber-Green" (RAG) status indicators to immediately draw the eye to areas that require attention. If your customer retention is in the "Green," you can move on; if it is in the "Red," you know exactly where to start your day.
Mobile responsiveness is no longer an optional feature. Founders and CEOs are rarely sitting at a desk all day; they need to check their "revenue engine" while in transit or between meetings. Modern BI tools like Power BI and Looker Studio allow for "mobile-first" layouts that reorganize the charts into a single-column view for easy scrolling. This ensures that the most important data is always at your fingertips, regardless of where you are. We also prioritize "drill-down" capabilities, allowing users to click on a high-level chart to see the underlying data points without leaving the interface.
Automation and Alert Configuration
Setting up the right alerts is a balancing act. Too many alerts lead to "notification fatigue," where the team starts ignoring them. We recommend starting with threshold-based alerts for your top three KPIs. These are triggered only when a metric crosses a critical boundary. For example, an alert could be sent if "Available Cash" drops below a certain level or if "Customer Support Response Time" exceeds four hours. This ensures that when an alert happens, the team knows it is important and requires immediate action.
Automated executive reporting and distribution can replace hours of manual administrative work. Instead of a manager spending Friday afternoon compiling a weekly update, the BI system can automatically generate a PDF summary and email it to the board of directors at 5:00 PM. These reports can be customized for different audiences; the CEO gets a high-level strategic summary, while department heads get a detailed operational breakdown. Scheduled data refreshes ensure that everyone is looking at the same numbers at the same time, eliminating the common boardroom argument over whose spreadsheet is "more correct."
Step 5: User Training and Adoption Strategies
The most sophisticated BI system in the world is worthless if your team doesn't use it. Resistance to new technology is a natural human reaction, especially when it involves shifting from "gut feeling" to data-driven decision-making. Successful adoption requires a structured change management strategy that focuses on the value proposition for every employee. You need to demonstrate how the new system will make their jobs easier, reduce their manual workload, and help them achieve their personal performance targets.
In 2026, the secret weapon for adoption is the integration of AI-powered training assistants. These tools live inside the BI platform and can answer user questions in real-time. If a team member is unsure how to filter a report, they can simply ask the AI assistant, "Show me last month's sales for the West Coast," and the assistant will guide them through the process. This reduces the burden on your IT department and allows users to learn at their own pace. We also recommend identifying "Data Champions" within each department—early adopters who can help their colleagues and advocate for the benefits of the new system.
Training Program Implementation
A "one-size-fits-all" training approach rarely works. A sales rep needs to know how to track their pipeline, while an HR manager needs to understand employee turnover trends. We advocate for role-based training modules that focus only on the features relevant to each person's daily tasks. This keeps the training concise and high-impact. Video tutorials and a searchable internal knowledge base are also essential for self-paced learning, allowing new hires to get up to speed quickly without needing a formal workshop.
Hands-on workshops are the most effective way to build confidence. During these sessions, we encourage users to bring real-world problems they are trying to solve. By showing them how to find the answer in the BI tool during the training, the value becomes immediate and tangible. This active learning approach ensures that the information sticks and that the team feels empowered rather than intimidated by the new technology. The goal is to move the team from "having to use the tool" to "wanting to use the tool" because it makes their lives demonstrably better.
Change Management and Engagement
Addressing the psychological barriers to data adoption is as important as the technical setup. Some employees may fear that increased visibility will lead to micromanagement. It is critical to frame the BI system as a tool for empowerment and transparency, not surveillance. When everyone has access to the same data, it levels the playing field and allows for more objective performance reviews and resource allocation. Celebrating "Data Wins"—such as when an automated insight leads to a major cost saving—helps to build a positive culture around the new system.
Measuring adoption success is the final piece of the puzzle. Most modern BI tools provide usage analytics that show which reports are being viewed most frequently and by whom. If you notice that a particular department isn't using the system, you can proactively reach out to understand their challenges and provide additional support. Engagement is not a single event; it is a continuous process of gathering feedback and refining the system to better meet user needs. By listening to your team and making iterative improvements, you ensure that the BI system remains a vital part of your business's growth engine.
Step 6: Ensuring Security and Compliance in a Data-Driven World
As you centralize your business intelligence, the security of that data becomes paramount. In 2026, with regulations like GDPR, CCPA, and evolving AI-specific laws, you cannot afford a "set it and forget it" mentality toward data privacy. A single breach of customer information or proprietary financial data can result in catastrophic fines and irreparable brand damage. When we build automated BI systems at Botomation, we prioritize "Security by Design," ensuring that your data is encrypted both at rest and in transit.
Implementing Role-Based Access Control (RBAC) is the first line of defense. Not everyone in your organization needs access to every piece of data. Your marketing team needs to see campaign performance, but they likely don't need access to individual employee salary data or detailed company tax records. Modern BI tools allow for granular permission settings, ensuring that users only see the information necessary for their specific role. This "Principle of Least Privilege" significantly reduces the risk of accidental or malicious data exposure.
Automated Security Audits and Compliance
In the "Old Way," security audits were a manual, once-a-year headache. In 2026, we automate this process. We set up systems that continuously monitor for unauthorized access attempts or unusual data export patterns. If an employee who typically only views three reports a day suddenly tries to download your entire customer database at 2:00 AM, the system can automatically block the action and alert your security team. This real-time protection is essential for protecting your intellectual property in a digital-first economy.
Compliance is also handled through automation. We configure data pipelines to automatically anonymize or pseudonymize sensitive customer information before it enters the visualization layer. This allows your team to analyze trends and behaviors without ever seeing personally identifiable information (PII). By building these compliance checks directly into the code, you ensure that your business stays on the right side of the law without adding extra administrative burden to your team.
Step 7: Continuous Optimization and the Feedback Loop
The final step in automating your business intelligence is recognizing that it is a living system. Your business will evolve, your competitors will change their tactics, and new data sources will emerge. A static BI setup will eventually become obsolete. To maintain your competitive edge, you must implement a continuous optimization loop. This involves reviewing your KPIs every quarter to ensure they are still aligned with your high-level business goals and adjusting your dashboards based on user feedback.
We use AI agents to monitor the performance of the BI system itself. These agents can identify "Data Drift," where the relationship between variables changes over time, potentially making your predictive models less accurate. By catching these shifts early, we can recalibrate the algorithms to ensure your insights remain razor-sharp. This iterative approach is what allows our partners to stay ahead of the curve, constantly finding new ways to squeeze more efficiency and revenue out of their operations using modern SMB tools.
Building a Data-Driven Culture
Ultimately, the goal of these seven steps is to foster a culture where data is the language of the company. When every meeting starts with a look at the automated dashboard rather than a series of opinions, the quality of decision-making improves exponentially. This shift in culture is the real "revenue engine." It allows your team to move faster, take calculated risks with confidence, and pivot quickly when the data shows a change in market conditions.
Our experts at Botomation don't just hand over a tool; we partner with you to ensure this culture takes root. We help you refine your processes so that the insights generated by the BI system are translated into tangible business actions. Whether it's optimizing your supply chain, refining your sales scripts, or reallocating your marketing budget, the data provides the roadmap. By following this 7-step framework, you are not just installing software—you are building a smarter, more resilient version of your business that is ready for whatever 2026 and beyond might bring.
Frequently Asked Questions
Do I need a dedicated data scientist to manage these tools?
No. Modern affordable business intelligence tools for growing companies are designed for self-service, meaning they can be managed by your existing operations or IT team. Our agency handles the complex initial setup and custom coding, leaving you with a user-friendly interface that doesn't require advanced technical skills to operate daily.
How long does it take to see a return on investment?
Most growing companies see a measurable ROI within three to six months. This typically comes from identifying wasted ad spend, reducing manual reporting hours, and improving customer retention through better data visibility. The "New Way" of BI focuses on quick wins that fund longer-term automation goals.
Can these tools handle data from custom-built legacy systems?
Yes. Through custom API integrations and automated ETL (Extract, Transform, Load) pipelines, we can pull data from almost any source. Even if your software is decades old, as long as there is a way to export the data or access the database, we can integrate it into your modern BI dashboard.
Is my data safe in a cloud-based BI tool?
Enterprise-grade tools like Power BI and Looker Studio use the same security protocols as global banks. When combined with our custom security configurations, such as multi-factor authentication and role-based access, your data is often more secure in these environments than it is on a local office server.
What happens if our business needs change in a year?
The beauty of affordable, modern BI is its flexibility. Unlike legacy systems that are hard-coded and difficult to change, our cloud-native approach allows for rapid adjustments. We can add new data sources, create new KPIs, and modify your dashboards in days, ensuring your BI system scales alongside your business.
Ready to automate your growth? Stop losing money to manual processes and opaque data. Our team of experts is ready to build your custom revenue engine using high-speed code and intelligent AI agents. Book a call below to start your transition to the New Way of business intelligence.
Get Started
Book a FREE Consultation Right NOW!
Schedule a Call with Our Team To Make Your Business More Efficient with AI Instantly.
Read More

Affordable BI Tools for Growing Companies 2026 Guide
Discover the best affordable business intelligence tools for growing companies in 2026. Automate analytics, use AI agents, and scale with enterprise-grade SMB tools.

Enterprise-Grade Solutions for Small Businesses 2026 Guide
Learn how WhatsApp AI slashes support costs for e-commerce & SaaS. Proven strategies to boost sales, recover carts, and scale 24/7 service.